

Analytics & Leads > Event Tracking
Analytics Overview
How SuperFunnel tracks events and conversions, how to view analytics for your pages and quizzes, and how to keep your data accurate.
Overview
SuperFunnel analytics are built on events — recorded actions that happen during a visitor's journey. Every number you see in your analytics dashboard is derived from events: views, clicks, submissions, purchases, and more.
Three terms are worth understanding before diving into your analytics:
- Event — any tracked action, on-page or in your backend. The broadest category.
- Conversion — a specific event designated as a meaningful outcome for your business, such as a form submission, purchase, or demo booking. Conversions are the primary metric you are optimising.
- Lead — a visitor record created when someone submits a form or takes a qualifying action.
SuperFunnel tracks two categories of events, each suited to a different point in the user journey.
| Aspect | Online Events | Offline Conversions |
|---|---|---|
| What | Interactions that happen on the page — clicks, scroll depth, micro-conversions | Business outcomes that happen after the user leaves — purchases, signups, booked demos |
| How | JavaScript function called from your page (window.sf.reportEvent()) | POST request sent from your backend server |
| Set up by | Page builders, marketers | Developers |
| When | Real-time, during the visit | After the conversion event occurs in your system |
Use both together
Use both together for the fullest picture: online events capture engagement signals during the visit, and offline conversions close the loop on what actually happened in your backend and in the real world.
Analytics Dashboard
Both Pages and Quizzes have a built-in analytics view showing event data for that asset. The table displays all tracked events as columns, with each row representing a variant, date, or other breakdown depending on your view.
Device breakdown
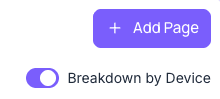
A Breakdown by Device toggle in the top-right of the analytics panel splits all numbers into Mobile and Desktop columns, so you can compare performance across device types at a glance.
Sorting
Click the arrow next to any column header to sort the table by that column, ascending or descending.

Showing and hiding columns
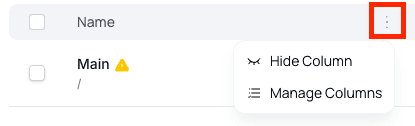
Hover over any column header to reveal a vertical ellipsis (⋮). Clicking it gives you two options:
- Hide Column — removes the column from your current view
- Manage Columns — opens a panel listing all available columns for that asset
Discover more metrics with Manage Columns
The default view shows only the most common columns. Opening Manage Columns reveals additional metrics that may be relevant to your funnel — such as button clicks, unique link clicks, scroll depth milestones, and more. Add any that are useful for what you're optimising.
Filtering Analytics for Accurate Data
Analytics filters let you narrow down the data shown in your dashboard — by traffic source, URL parameters, date range, and more. Using filters correctly is one of the most important habits for keeping your numbers trustworthy.
The problem: testing in production
It's common to test a live page directly in the browser — clicking through a quiz, submitting a form, checking how a variant looks. These visits can get recorded as real analytics data, inflating your numbers.
SuperFunnel has a built-in test mode to prevent this. To use it:
- Click the Open button next to a variant name in the page overview
- Select Open in production — this opens the live page in a new tab with the query parameter
sf_env=testappended to the URL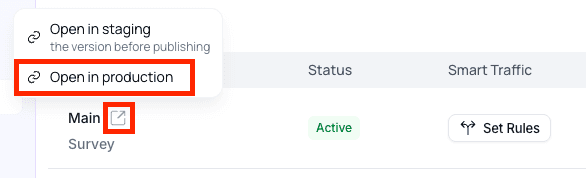
- A banner at the bottom of the page will confirm "Test Mode Active | Events recorded as test data"

Events recorded in test mode are flagged separately and won't pollute your production analytics.
Direct URL visits still record as live data
If you navigate to your page URL directly — without the sf_env=test
parameter — your visits are recorded as real traffic. Use the Open in
production button to ensure test events are properly flagged.
Filtering out noise with analytics filters
If test data or internal traffic has already been recorded, or you simply want to focus on a specific audience segment, use filters to isolate the data you care about.
Filter by Origin
The Origin filter lets you include or exclude traffic based on its source.
For example, if you're running Google Ads, you can set:
Origin → Is any of → (select each Google-related origin you see)
This narrows the view to only visitors who arrived via Google, filtering out direct visits, internal testing, or other channels.
Filter by URL Parameters
If your real users always arrive via a link (for example, from an ad or email), they'll typically have URL parameters present — such as utm_source, utm_campaign, or custom parameters from your CRM. Someone testing the page directly by typing the URL won't have any of those parameters.
Use the URL Params filter to include only sessions where a specific parameter is present. This is an effective way to exclude direct-access visits that are likely internal or test traffic.
Combine filters for the cleanest view
Using Origin and URL parameter filters together gives you the most accurate picture of your real audience. Start with Origin to isolate your intended channel, then layer on URL parameter filters to further exclude any visits that don't match the expected traffic pattern.