

Analytics & Leads > Variant Analytics
Variant Analytics
View a section-by-section analytics breakdown for any page variant — including time on section, element clicks, and other engagement.
Overview
Variant Analytics gives you a visual breakdown of how visitors interact with a specific page variant. Rather than showing aggregate numbers alone, it overlays live data directly onto a preview of the page — so you can see exactly which sections hold attention, which buttons get clicked, and how popups perform.
Metrics shown per variant:
- Page visits, conversions, button clicks, form submissions — summary bar at the top
- Average time on section — how long visitors spend in each section
- Section visits — how many visitors scrolled into each section
- Button clicks — click count per individual button or link
- Popup views and clicks — engagement data for any popup on the page
Accessing Variant Analytics
Open the page
From the left sidebar, navigate to Pages and open the page you want to review.
Find the variant
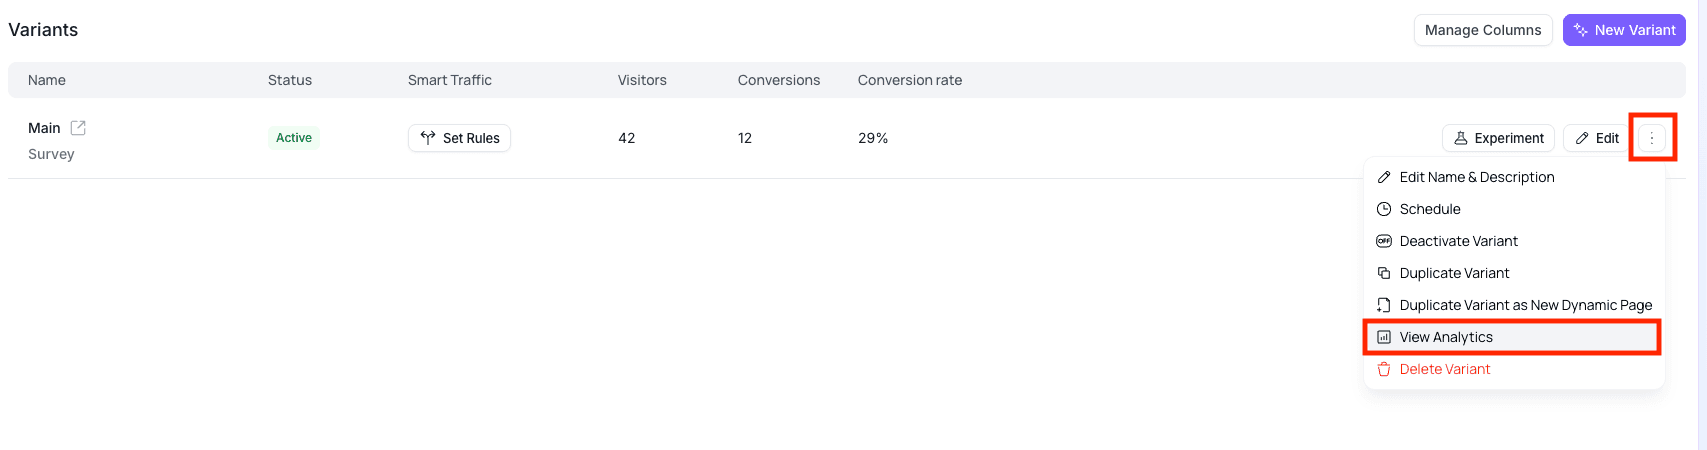
In the Variants table, locate the variant you want to analyse. The table shows current visitor counts, conversions, and conversion rate at a glance.
Open the variant menu and click View Analytics
Click the ellipsis ⋮ icon on the right side of the variant row to open the variant options menu. Select View Analytics from the dropdown. The analytics view will open.
Reading the Analytics View
Summary bar
At the top of the view, a bar shows aggregate stats for the variant:
- Page visits — total number of sessions that loaded this variant
- Conversions — total conversion events recorded
- Button clicks — total clicks across all buttons on the page
- Form submissions — number of form completions
- Avg time — average total time a visitor spent on the page
Section and element overlays
Below the summary, the page is rendered as a visual preview with data overlaid on each element.
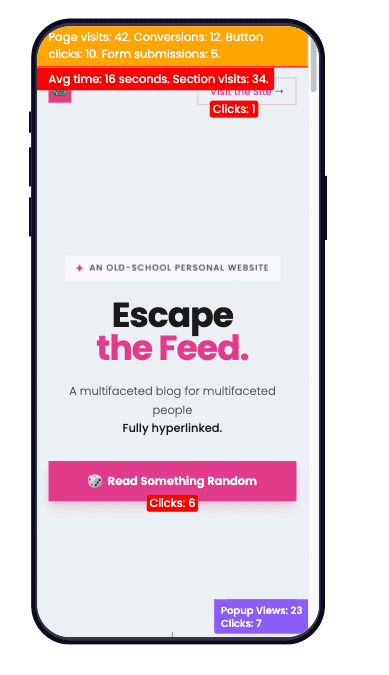
Each section shows:
- Avg time — average seconds visitors spent within that section
- Section visits — number of visitors who scrolled the section into view
Each button or link shows:
- Clicks — total number of clicks on that element
Popups show:
- Popup views — how many times the popup was triggered
- Clicks — how many times visitors clicked within the popup
Section detail
Sections with low engagement relative to others are easy to spot — a short average time or low visit count compared to sections above it often indicates visitors are dropping off before reaching it.
